Climate Change
Over the past 10,000 years, the Earth’s climate has allowed civilizations to blossom, relying on steady conditions to cultivate land. Now, greenhouse gas emissions are causing rapid warming of the planet's climate. Communities and ecosystems worldwide can’t adapt to temperature rise at current rates. Solutions need to be rapidly put in place to overcome this global challenge.
Climate Change Is Already Happening
Extreme weather events are increasing
In some areas, storms are becoming stronger and more frequent and precipitation patterns are changing. The number of high precipitation days are projected to increase in areas already vulnerable to natural disasters like flood and landslides, leading to loss of life and infrastructure. In other areas, climate models project longer and more intense heat waves and dry spells that will reduce soil moisture, increase vegetation stress, and increase the length of the fire season.

Country Level Context
Global temperatures are rising at unprecedented levels. Since 1880, global temperatures have risen by more than 1˚C (1.8˚F), while levels of carbon dioxide in the atmosphere have increased from 280 parts per million (ppm) to more than 400ppm. Atmospheric and oceanic temperatures have steadily climbed, and the impacts of this warming are clear. Glaciers are receding or disappearing and Arctic sea ice is declining. Antarctic and Greenland ice sheets are melting and sea levels are rising. Scientists have determined that it is extremely likely the increase in greenhouse gas emissions from human activity is the largest driver of this change.
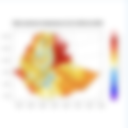
Mean Temperature
Ghana
Greenhouse gases in the atmosphere have increased rapidly since the beginning of the Industrial Revolution. Emissions are projected to increase as population and resource demand grows. When multiple maps are displayed on the dashboard, any maps that include a description will automatically alternate their layout to enhance visual balance and readability. This means that the map and its accompanying description will switch positions appearing side by side but alternating sides as you scroll through the content. This layout helps create a more engaging and organized presentation, especially when working with several map blocks in a row.
Mean Temperature
MapviewerTrends and Patterns
Safeguarding the Future: Climate Action for Generations to Come
Climate change poses one of the greatest challenges for future generations, as the choices we make today will determine the world they inherit. Rising temperatures, extreme weather, and loss of biodiversity threaten not only the environment but also food security, health, and livelihoods. Protecting future generations means acting now to reduce emissions, invest in sustainable solutions, and safeguard natural resources so that they can thrive in a stable, healthy, and resilient world.

Actions we take now will influence the future climate
Today’s decisions – and indecisions – will shape what the world will look like for decades, even centuries to come. Our ability to limit dangerous climate change and achieve development goals will be determined by whether we can fundamentally change the way we frame problems and make decisions, moving from a myopic and reactive approach to a far-sighted approach that is transformational and guided by a shared vision.
Comparison Raster Tile Example
Ashanti
Over recent decades, Ghana has experienced a gradual increase in average temperatures, with hotter and drier conditions becoming more frequent in the northern regions. Rainfall patterns have become more erratic, with shorter rainy seasons and more intense downpours, contributing to both droughts and floods. These changes are already affecting agriculture, water resources, and public health, particularly in vulnerable communities.
Comparison Raster Tile Example
Multivariable chart
Multivariable chart
Ghana
Pour Toutes les stations's pressure lecture, basée sur l'analyse de 2023 à 2026, en moyenne, le les lectures les plus élevées de 111% (plus que prévu) le taux de transmission était Enregistré dans 2023 tandis que le le taux de transmission le plus bas était 64% Enregistré dans 2025 .
Surface Air Temperature Anomaly
MapviewerWhat this means
This table presents key climate change indicators for Ghana, highlighting long-term trends and observed impacts. Over recent decades, Ghana has experienced a gradual increase in average temperatures, with hotter and drier conditions becoming more frequent in the northern regions. Rainfall patterns have become more erratic, with shorter rainy seasons and more intense downpours, contributing to both droughts and floods. These changes are already affecting agriculture, water resources, and public health, particularly in vulnerable communities. The data underscores the urgent need for climate adaptation strategies and sustainable land use planning to build resilience across sectors.
Climate Change Indicators in Ghana
| Indicator | Description | Observed Trend | Projected Trend | Impact |
|---|---|---|---|---|
| Temperature (°C) | Average annual temperature | ↑ ~1.0°C since 1960 | ↑ 1.5–2.5°C by 2050 | Increased heatwaves, crop stress, health risks |
| Rainfall Patterns | Seasonal and annual rainfall levels | ↑ variability, ↓ in some regions | ↑ unpredictability, possible ↓ in long rainy season | Crop failure, water shortages, conflicts over water |
| Extreme Weather Events | Frequency of floods, droughts, storms | ↑ frequency of floods and droughts | ↑ intensity and frequency | Loss of life, infrastructure damage, displacement |
| Sea Level Rise | Coastal erosion and saltwater intrusion | Coastal areas eroding rapidly | ↑ 30–50 cm by 2100 | Loss of coastal land, saltwater intrusion into freshwater sources |
| Agricultural Productivity | Yields of key crops like maize, cocoa, cassava | ↓ in some regions due to temperature and rainfall shifts | ↓ further with more climate stress | Food insecurity, loss of income for farmers |
| Malaria Risk Zones | Areas suitable for malaria transmission | Expansion to higher elevations | Further expansion into previously low-risk areas | Public health burden, strain on health system |
| Hydropower Generation | Electricity production from dams (e.g., Akosombo Dam) | ↓ during drought years | ↑ uncertainty in water availability | Energy shortages, need for alternative energy sources |
Subnational Estimates
Introduction
The country’s climate is shaped by its diverse landscapes—from humid coastlines and fertile highlands to expansive arid and semi-arid zones. These environments respond differently to variations in temperature, rainfall, and extreme events. Understanding how these climate patterns are shifting is essential for planning agriculture, water resources, infrastructure, and disaster preparedness.
This dashboard highlights the key indicators that define the country’s climate today, how they vary across seasons and regions, and what they mean for future resilience.
Human health could be affected
Increased extremely hot days may prove fatal to vulnerable populations, and harmful species like mosquitos that transmit diseases such as malaria, dengue, and zika are also changing their habitat ranges, with implications for human health. WHO estimates that heat exposure, malaria, food scarcity and lack of access to clean water and shelter due to climate change may result in up to 250,000 additional deaths per year.
Climate Insights Overview
Temperature Trends
Rainfall & Seasonal Patterns
Extreme Weather Indicators
Vulnerability & Exposure
Climate Projections (Future Scenarios)

Actions we take now will influence the future climate
Policy and technology will influence future emissions
Today’s decisions – and indecisions – will shape what the world will look like for decades, even centuries to come. Our ability to limit dangerous climate change and achieve development goals will be determined by whether we can fundamentally change the way we frame problems and make decisions, moving from a myopic and reactive approach to a far-sighted approach that is transformational and guided by a shared vision.
RGB Natural Color
MapviewerReduce Emissions Today
Cutting greenhouse gas emissions now slows the rate of warming and reduces the severity of future climate impacts.
Protect and Restore Nature
Healthy forests, wetlands, and ecosystems absorb carbon and shield communities from floods, droughts, and extreme heat.
Build Climate-Resilient Systems
Strengthening infrastructure, agriculture, and water management today prepares the country for tomorrow’s climate extremes.
Invest in Clean Energy
Expanding renewable energy reduces dependence on fossil fuels and supports long-term sustainable development.
Empower Communities & Early Warning
Community awareness and early warning systems help people prepare, respond, and recover more effectively from climate hazards.
Bulletins

Press Release
Latest Updates

Plan National Strategique De La Meteorologie Du Togo : La D…